Posts By: Busayo Ajao
30 August 2024
Open Beta Invitation and Other Good Stuff Inside
Hello, Heroes!
We’re back with another dispatch from the development floor. While we’ve been busy tweaking code and balancing economies, we have some major news that you’ll want to hear. 😉
🥁🥁🥁Drum roll, please…
Open Beta is Around the Corner! 😍
That’s right. From September 13th to 15th, we are hosting a limited open beta. This is your chance to get a hands-on look at the latest build and show us what you’ve got.
We’re opening the doors because we need your sharp insights. Your gameplay experiences and feedback are essential for us to refine the game before our official demo in October. We want to know what strategies you discover, what challenges you face, and how it feels to build your empire from the ground up.
A quick heads up: beta slots are limited. We will be sending keys out on a first-come, first-served basis.
If you’re ready to put your strategic mind to the test, you can secure your spot by requesting access right here: http://eepurl.com/hL3Qvv
With that out of the way, let’s talk about what’s new.
New Game Setup Screen
Every great business plan starts with a clear understanding of the landscape. Your game setup screen should be no different. Here is the old version for context:

We felt the old design was a bit cramped. Now, your career begins with a redesigned screen that gives you a much clearer tactical overview. The new, spacious layout and richer color palette make it easy to see your starting conditions. Critical factors like weather forecasts, starting capital, regional GDP, and current interest rates are displayed prominently. You will immediately understand how each one affects your journey.

We also introduced a new difficulty gauge that visually represents the challenge ahead. This also fixes a small but important usability issue where players, eager to dive in, tried to click the old static indicator to change the difficulty.
Preventing Unintended Consequences
Have you ever ordered a massive shipment of coffee beans, only to have a stroke of genius for a new tea-based product moments later? In a complex system like this, a small change can create big problems. Altering a recipe after an ingredient order is placed or switching research priorities midway can accidentally sabotage your own carefully laid plans.

To help you stay in control, we’ve implemented smart alerts. These new pop-ups will appear when you’re about to make a decision with significant knock-on effects. They will explain the potential consequences of your action, such as having a truckload of unwanted inventory, and ask you to confirm your decision.
This feature ensures a simple oversight does not undo your strategic genius.
Other Improvements & Fixes
For a full list of our smaller tweaks and bug fixes, you can read our short weekly update on Steam.
That’s all for now. We can’t wait to hear what you think of these changes.
Cheers 🥂
Don’t forget to Wishlist the game if you haven’t: https://store.steampowered.com/app/1429080/
Live Long and Prosper 👋,
Kunal & team
Follow For More
16 August 2024
Ordering, Inventory, and Tutorial System Implementations
Hello, Heroes!
Welcome back to our latest update! The last two weeks have been quite busy as the team worked tirelessly to implement several key features we’ve been discussing.
From the ordering system to inventory management and introducing new gameplay challenges, there’s a lot to cover.
Here’s how the ordering system looks in manual mode. We shared the difference between manual and automatic mode here:

Discarding Inventory
A longstanding pain point has been the management of surplus ingredients that take up more storage space than necessary.
Previously, the only solutions were to either incorporate surplus items into recipes where they didn’t really belong or to cease ordering them all together, hoping to balance the stock manually over time.
Neither approach was particularly satisfying or realistic.
To address this, we’ve implemented a new ‘Discard Inventory’ function that allows you to delete either a portion or the entirety of any ingredient that’s cluttering your storage.

Gameplay Discovery
The first version of the basic challenges is now being tested. As mentioned in the last episode, their purpose is to help you discover the game’s mechanics by doing.

In future updates, completing missions will earn you research XP. You can use this XP to decrease the time it takes to unlock research items.
Other Improvements & Fixes
For a list of other improvements and fixes, check out our short weekly update on Steam.
And that’s a wrap for today!
Your feedback is crucial; we’d love to hear your thoughts about these improvements.
Cheers 🥂
Don’t forget to Wishlist the game if you haven’t: https://store.steampowered.com/app/1429080/
Live Long and Prosper 👋,
Kunal & team
Follow For More
2 August 2024
In search of the perfect tutorial system
It’s another Friday, and you already know it’s time for the latest development update on our progress.
We will be discussing the work the team is doing around the tutorial system today. But, before we get into that, just incase you missed it, we announced our demo date in this tease trailer:

Now, to the tutorial system. 🙈
Design Challenges
Designing a strategy game’s tutorial system isn’t the most straightforward task, especially when trying to cater to the needs of both Achievers and Explorers, two prominent types of strategy gamers.
Achievers often appreciate structured guidance and clear objectives. Meanwhile, Explorers enjoy discovering game mechanics on their own with little or no handholding.
To balance these preferences, we divided our tutorial into two parts consisting of a navigational guide and gameplay discovery.
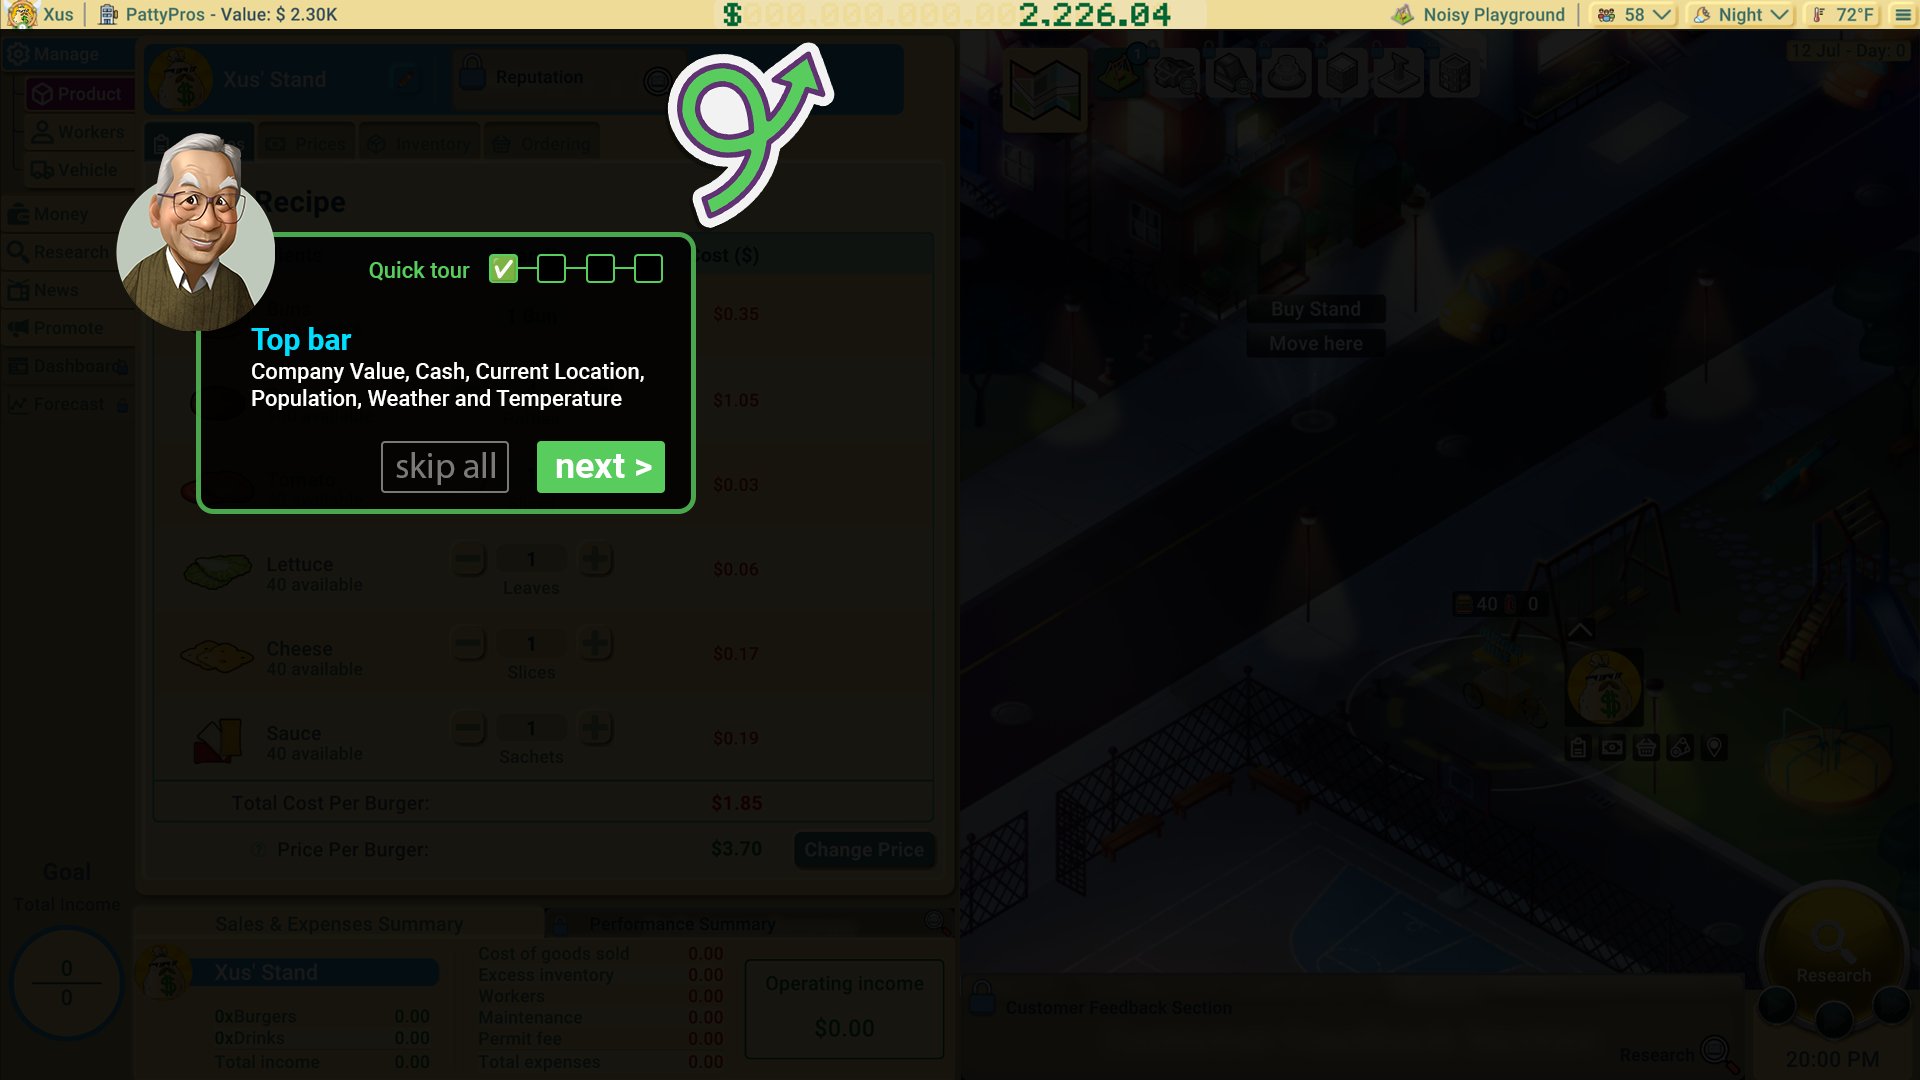
Navigational Guide
The first part is a skippable navigational guide that introduces you to the game’s interface. It highlights essential areas such as the top bar, play controls, and more.

Why is this important? Strategy game UIs are notorious for being overwhelming for new players. For instance, the first time I saw the UI for Stellaris or Civilization, I felt quite lost.

While the game is on a much smaller scale than those examples, playtests have revealed that there is a real potential for the UI to be slightly overwhelming.
By offering a navigational guide, we hope to help players quickly understand where everything is, reducing frustration and making the game more accessible.

However, recognizing that some players might find this unnecessary, we made it skippable from the very first playthrough.

Gameplay Discovery
The second part of the tutorial is more hands-on and interactive. Instead of handholding you through each mechanic, we set mini-goals and provide tips that help you discover the game’s mechanics by doing.

As you complete these challenges, you gain experience points, which can be used to unlock items in the research tree.
This tutorial style allows players to retain information better because they are actively involved in the process.

We believe this method works exceptionally well for tycoon and management game players, as it mirrors the decision-making and strategic planning that are core to the gameplay.
Core Considerations
While designing the tutorial, the following considerations are front and center in our minds:
- Player Autonomy: Giving players the freedom to skip or tackle things at their own pace.
- Reward System: Making the entire experience rewarding. Linking tutorial completion to experience points and research tree progression is an example of this. We’d love to hear your ideas for more ways to improve this.
- Clarity and Simplicity: Ensuring that all aspects of the tutorial are clear and straightforward with minimal cognitive load.
Work in Progress
As usual, the system is still in development. Some variation in the final version is to be expected.
Overall, our goal for the system is to provide essential guidance while respecting your autonomy. We hope this dual approach will allow players to discover the game mechanics efficiently without feeling overwhelmed or constrained.
And that’s a wrap for today!
Your feedback is crucial; we’d love to hear your thoughts about how we can improve the tutorial system.
Cheers 🥂
Don’t forget to Wishlist the game if you haven’t: https://store.steampowered.com/app/1429080/
Live Long and Prosper 👋,
Kunal & team
Follow For More
19 July 2024
Bringing Classic Inventory Management Back
We sincerely apologize for missing our last update. Some unexpected circumstances prevented us from reaching out.
But we’re back on track now and excited to get into all the good stuff you’ve missed!
Classic Inventory Management
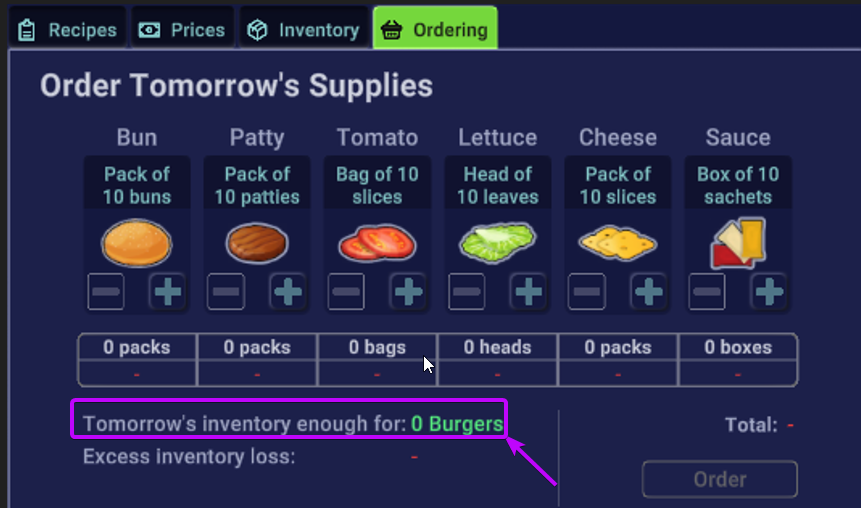
In keeping with classic inventory management, we have removed the automatically generated figure showing the number of burgers available for sale.

Now, you get the opportunity to flex those math muscles by figuring out how many ingredients you need to order based on the amount used in your recipe.
This change does two things:
- Eliminates the potential for mindless inventory ordering during the early stage of your business.
- Allows you to gain a clearer, more granular view of how ingredients flow through your business.
To improve access to the figures you need, we added an inventory section to the ordering view.

Subtotal shows the total number of inventory items in storage plus new items ordered. Recipe shows the number of ingredients being used in the current recipe.
Together, both figures form the basis for calculating how much inventory you need to order to avoid running out of stock during the day.
Of course, as your business grows in complexity, you will be able to research tools to help automate this process.
Research Queuing
The research view now has a visualizer that shows items being researched. Said visualizer also allows you to clear all research and start a new research queue at any time.

Performance Summary
Now researchable in tier 1, the performance summary displays some of your business’s most important Key Performance Indicators (KPI).

From your stand’s reputation and worker happiness to the number of positive and negative feedback your stand received, it’s all on display.
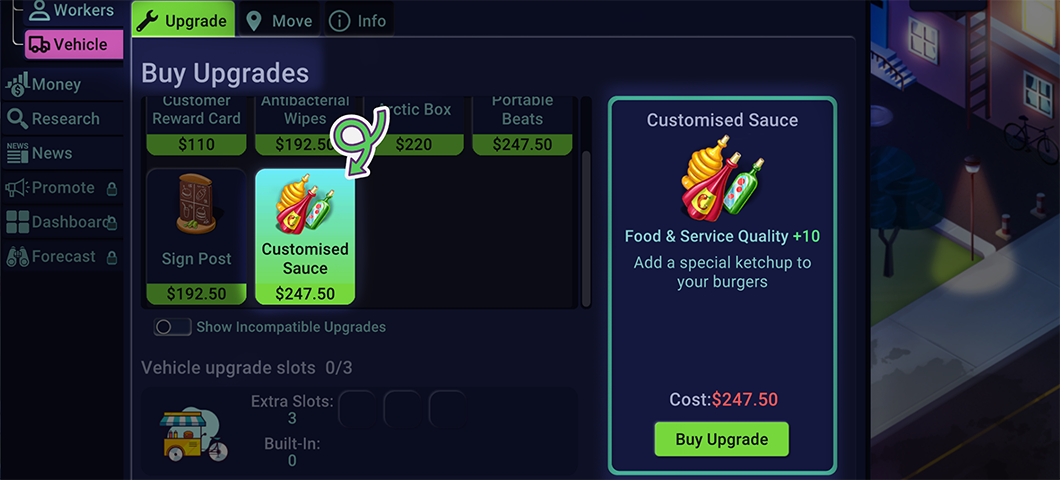
Upgrades Compatibility
A vital aspect of the upgrades research we missed was showing stand compatibility information. This omission increased the likelihood of unlocking upgrades that weren’t compatible with your stand.

Now, you can see which stands are compatible with the upgrade you are about to research.
And that’s a wrap for today!
Your feedback is crucial; we’d love to hear your thoughts about these improvements.
Cheers 🥂
Don’t forget to Wishlist the game if you haven’t: https://store.steampowered.com/app/1429080/
Live Long and Prosper 👋,
Kunal & team
Follow For More
21 June 2024
New Improvements and Bug Fixes
We are back again with the latest updates on our development! The last two weeks have been packed with improvements and bug fixes.
Here are some of the highlights.
New Improvements
Research Unlock Voiceovers: We’ve added voiceovers to many research items to provide essential context and guidance upon unlocking them. The system also includes playback controls and scrolling text for improved accessibility.
And for those who absolutely can’t stand voiceovers interrupting their flow, we added a mute button for you.

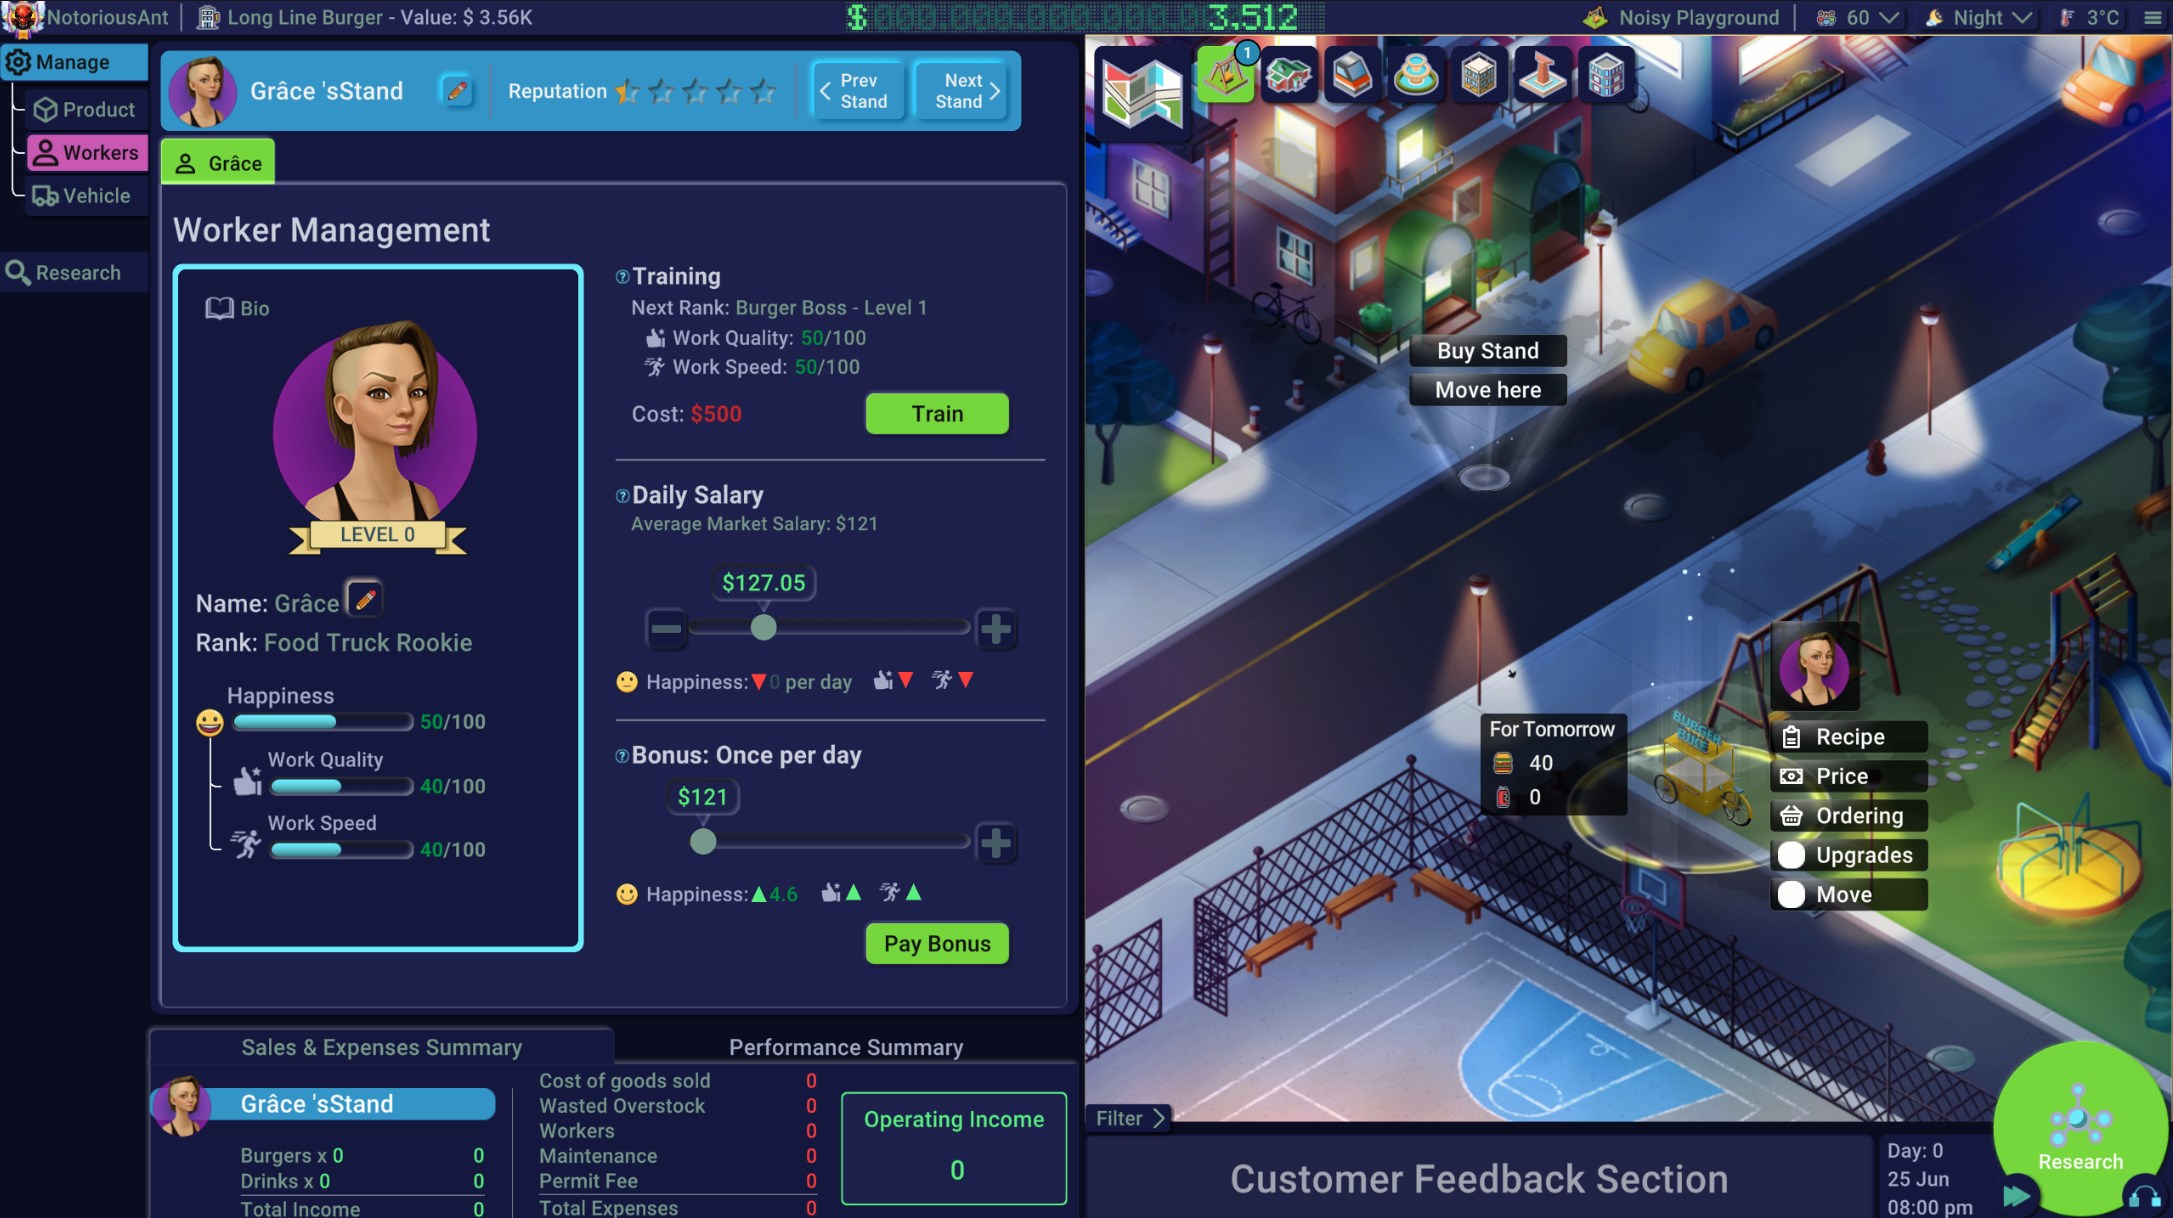
Self-managed Stands: You now manage your first stand personally from day one. This means early savings on worker salaries and bonuses until you unlock management capabilities.

There might be a few limitations to managing your stand personally as your company grows.
But the jury’s still out on what those might be. Fingers crossed.😉
Balance Sheet and Cashflow: In keeping with the rest of the UI, we’ve split the balance sheet and cashflow statement into separate tabs.
We also tweaked the presentation a bit to give it that extra accounting flair. Hopefully, all ye number crunchers would love the new look. 😄

Other Improvements
- The recommended icon in the research view has been updated for improved visibility.
- We’ve integrated both dark and light themes into the banking view and adjusted the layout for a smoother experience.
- We’ve added counts of burgers and drinks sold to the cash-received animation, making sales tracking more exciting.
- The Pricing Survey UI has been improved, with the survey button placed after price controls for better flow.
Bug Fixes 🐞
- The game no longer attempts to get multiplayer data for workers in single-player mode.
- We also fixed an error that occurred during end-of-day reports when tier 2 research was ongoing.
- The accounting system now correctly handles expired ingredients at night, preventing errors.
- Other fixes included resolving variables in customer feedback tooltips and preventing non-interactable buttons from being highlighted.
And that’s a wrap for today!
Your feedback is crucial; we’d love to hear your thoughts about these improvements.
Cheers 🥂
Don’t forget to Wishlist the game if you haven’t: https://store.steampowered.com/app/1429080/
Live Long and Prosper 👋,
Kunal & team
Follow For More
7 June 2024
Oops! Fixing the Events System, Again
Hope you had a great week! Today, we will explore the redesign of the game’s Events system and why we had to modify it…again. 😭
To see how the events worked previously, read this edition.
So, Why the Redesign? 🤔
The addition of the research system, which allows you to progressively unlock various aspects of your business, introduced a crucial mismatch with the existing Events logic.
Suddenly, we had events triggering changes to areas of the business that had not been researched yet, causing significant confusion (to put it mildly). 😮
Clearly, we had to fix that. 😂

Redesign Goals 🎯
Our goal was twofold:
- Ensure that events only impact researched aspects of your business.
- Do the above while avoiding monotony and maintaining a fun/rewarding challenge.
Easy-peasy…or maybe not.
We are still trying to solve the second part. 🤣
Anyways, the following is how the new events system currently works. It’s still in development and will be finalized after some rigorous testing.
New Design ⚒️
For the new design, we’ve:
- Expanded the levels of events.
- Eliminated the news selection option.
- Introduced a more structured approach to how events unfold.
Here’s how.
Stage-Based Dynamics: The events are now divided into different stages based on in-game days. This makes more sense since the research is equally tied to game days.

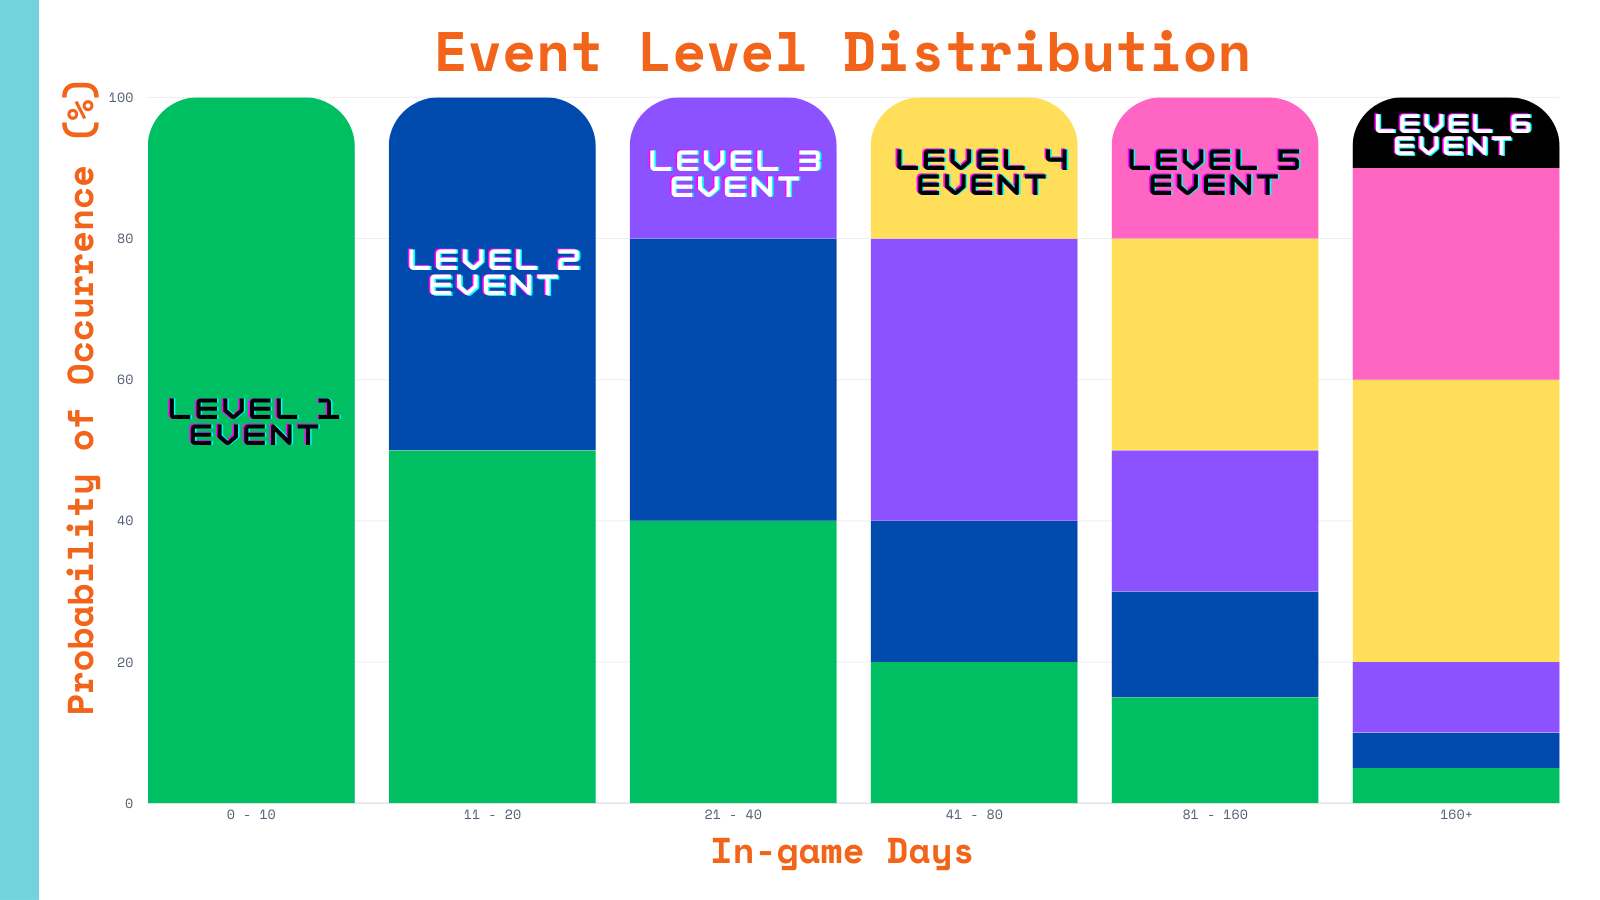
Event Levels & Types: The system now features six levels of positive and negative events. Each level unlocks as you progress through your game-day milestones.
The event level indicates the severity of the in-game impact, both positively and negatively.
For instance, a level 2 positive event will be less impactful in terms of effect and/or duration than a level 5 or 6 positive event.
This is the current event level distribution across the event stages:

As you progress through the game-day milestones, you’ll face an increasing mix of event-severity, challenging you with more complex scenarios.
Event Probabilities: We have also modified the probabilities of positive, negative, and no events occurring at each game stage.
The graph below shows the current probability distribution for each type of event.

Stage 1 starts with a higher probability of positive and no events occurring. Over time, negative events increase to push out no-event instances until a balance is reached at stage 6.
We will keep you posted on any improvements and changes as we roll the system into testing.
And that’s a wrap for today!
Your feedback is crucial; we’d love to hear your thoughts about this new system and how we can improve it.
Reply to this email 📧 or chat with us on Discord. 💪
Cheers 🥂
Don’t forget to Wishlist the game if you haven’t: https://store.steampowered.com/app/1429080/
Live Long and Prosper 👋,
Kunal & team
Follow For More
24 May 2024
Trying to hit $6,900 & some juicy financials
Over the last few weeks, we’ve been working on improvements and new implementations as a fallout of our participation at the Endless Replayability Fest.
If you missed all the broadcasts showing the game in its latest state, don’t flip your burgers yet; you are in luck!
We saved one for you. 🕺
Watch me try, in hard mode, to hit a $6,900 total income goal in 15 days! 😂

Game Improvements
Ordering Animations: We’ve added animations to make the current burger count 🍔 and overstock notification ⚠️ more pronounced when ordering new ingredients.

Goal Tracker 🎯: The base goal-tracker functionality has been implemented. Right now, it only tracks your total income. 💰
We will expand it in later versions to power the entire mission system.
Research Duration 📅: The number of days required for each research item on the tech tree 🎄 is now visible. It’s also displayed for queued items too. Now, you won’t have to guess how long it will take to get your brand-new tech.

Language Settings: You can now change your language settings from the initial settings screen ⚙️ when the game loads.
Upgrades Carry Over: All purchased upgrades carry over to your new Stand when you upgrade to (as opposed to buying) a new Stand. 🚚

New Implementations 🛠️
Playing a business management game without juicy financials is like calling a bun with only ketchup a burger. 😏
It’s just not satisfying.
So, the money view 🤑 is what’s next on our implementation pipeline. This is the umbrella section for Accounts, Statements, and Banking.
The accounts section is still in progress, but the company and stand-level histories 🗓️ are already being processed quite well.

Detailed report at the company 🏢 level:

And at the food stand 🚚 level:

For the data visualizers in the house, your jam is definitely on our menu! The account section contains an assortment of graphs and charts. 📈📊
You’ll find detailed visuals on burger 🍔 and drink 🍹 sales, income, expenses, profit margin changes, and expense distribution.

All of which will be polished further as development continues.
And that’s a wrap for today!
As always, we’d love to hear your thoughts on these and any other improvements.
Cheers 🥂
Don’t forget to Wishlist the game if you haven’t: https://store.steampowered.com/app/1429080/
Live Long and Prosper 👋,
Kunal & team
Follow For More
It’s another Friday, and you know it’s time for another update on our progress.
Today’s episode looks at the latest version of the End of Day report and the research tree’s progress. But before we get into that, we have a little announcement we’ve been sitting on. 😉
Endless Replayability Fest! 🎉

That’s right, we will be part of Steam’s Endless Replayability Fest! 🕺💃
And that’s not all, we will be broadcasting the latest version of the gameplay during the festival and answering any questions you might have about the new gameplay. 😍
Broadcast dates and times will be shared via X. We certainly can’t wait to see you and hear your thoughts.
Now, moving on to the progress update for today. 😎
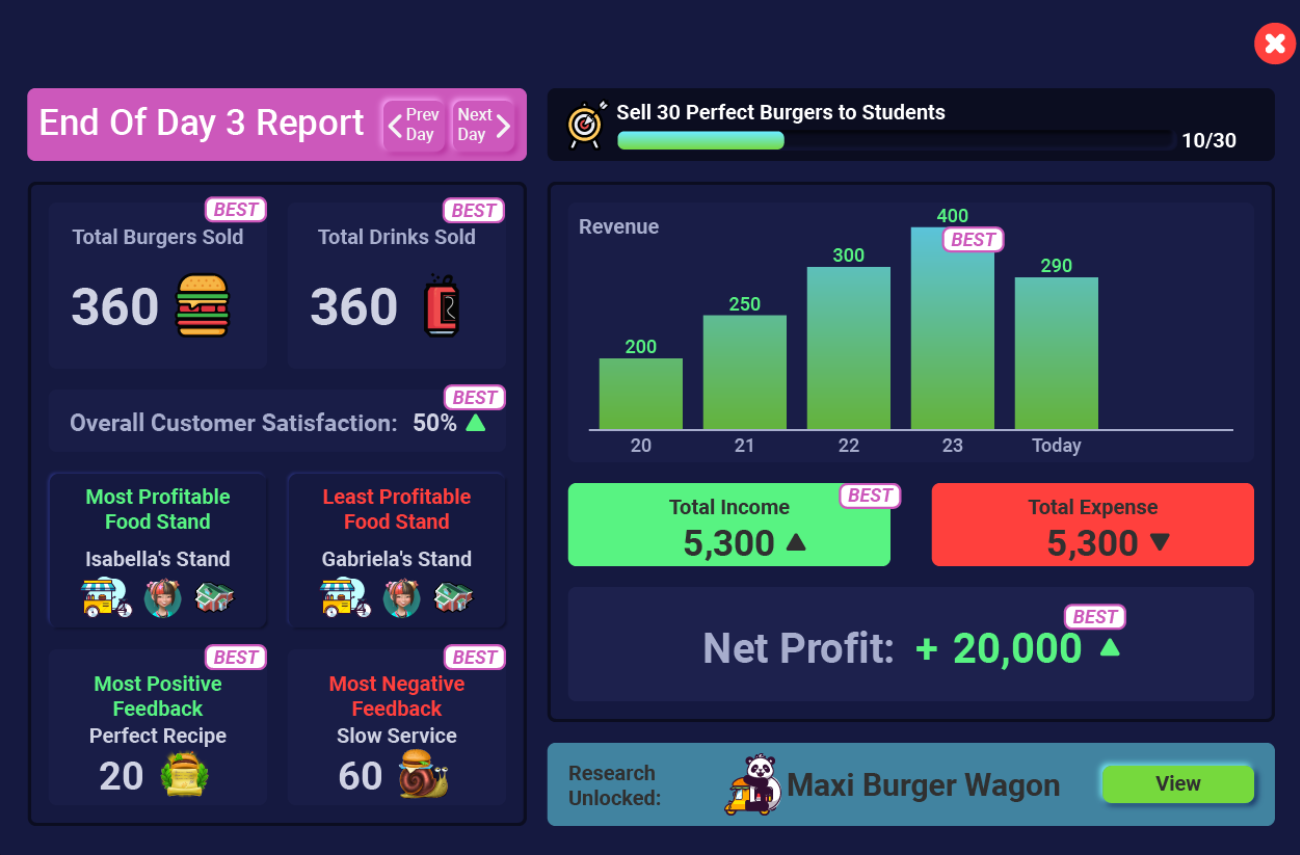
End-of-Day Report 📃
One factor all successful companies share is a relentless focus on performance. The End of Day (EoD) report captures essential aspects of the just-concluded day and displays them in an easy-to-digest report.
When determining the report’s content, we carefully selected metrics that provide a comprehensive view of the company’s overall health, including financial performance, operational efficiency, customer satisfaction, and specific insights into daily operations.

This was a bit tricky as we knew you’d most likely view this report in strategy optimization mode (nighttime), so we needed to ensure the data on display would be relevant regardless of your company’s size and research stage.
For example, we quickly noticed that the Most and Least Profitable metrics, although necessary during the growth phase, would provide less value in the early stages of your business.

Hence, we will modify that function for companies in the startup phase.
Given that you will probably want to refer to the EoD report as your business grows, we made it easily accessible from the gameplay screen via a collapse/expand button.
The report also delivers a notification about the status of your research as they are completed.

Research Tree Implementation 🎄
The research section is gradually beginning to look like how we envisioned. Much of it is still in progress, so expect to be pleasantly surprised when you see the final version.
This is the current state for Tier 1 research items:

Items can be researched individually, queued up, or prioritized over a research queue that’s in progress.

Depending on your research selection, notifications will appear in your End of Day report as the items become available.
And that’s a wrap for today!
As always, we’d love to hear your thoughts on these and any other improvements.
Cheers 🥂
Don’t forget to Wishlist the game if you haven’t: https://store.steampowered.com/app/1429080/
Live Long and Prosper 👋,
Kunal & team
Follow For More
26 April 2024
UI Updates You’ll Love! 😍
Welcome to another progress update! The past two weeks have been relatively quiet in the studio, as most team members were traveling or taking care of personal matters.
Still, we managed to make improvements to the UI, and we can’t wait for you to see them!
Dark Mode Integration 🌛
As you are (most likely) aware, the game has a dark mode feature, which you can toggle in the settings at any time. We’ve been integrating the dark theme into the latest version of the game while also making UI improvements.
Here’s how the UI looked while it was a work in progress:

And this is how it looks now 🤩:

In-Game Menu Options ⚙️
We’ve expanded the In-Game menu settings to include options for resolution, control keys, and performance, building on the previous audio and theme settings.

Something else we thought would be neat is to change how the in-game menu displays when accessed during your playthrough.
Instead of adding a pop-up menu on your screen, the game screen slides down to reveal the menu:

Accounting Summary Improvements 🗒️
The accounting summary at the bottom left of the UI provides a much-needed snapshot of your Stand’s performance per time. For many players, this will be their first and most frequently used financial dataset.
Given the importance of this section, we’ve improved the design to feature a side-by-side presentation of Income and Expenses, with Operating Income presented as a distinct figure.

This layout provides a clearer and more digestible overview of your Stand’s finances per time.
And that’s a wrap for today!
As always, we’d love to hear your thoughts on these and any other improvements.
Cheers 🥂
Don’t forget to Wishlist the game if you haven’t: https://store.steampowered.com/app/1429080/
Live Long and Prosper 👋,
Kunal & team
Follow For More
2 June 2023
13 Days of Open Alpha 🤩
Greetings, 👋
So, it’s been an exiting couple of weeks after the release of our Open Alpha playtest. We are so grateful to everyone for playing this early development version and taking out time to provide fantastic feedback. 😍
Special thanks to:
- Pkay Outlaw
- Serzal
- David Maza
- Dennis Ho
- Klebb
- Orcosauraus
- Roogna
- Seth
- Brian
- Lopata_eu
- Marcacia726
- Yash
- Fiery
- Eleven
- ItsMegs
The median playing time is 2 hours and 22 minutes! 😮 Quite a bit more than we expected considering the current development progress.
Hall of Fame 🏆
We currently have 7 players in our playtests Hall of Fame. These are players who have completed all Master Lee’s missions in the playtest and have successfully unlocked Sandbox and Multiplayer modes.
Massive congratulations to everyone on the list🎉:

If you’ve completed Master Lee’s missions and your name is not on the list, join us on discord and let us know when you completed them. ⭐
You deserve recognition. 😉
Also, our discord is the place to be if you’re looking for tips and tricks to help you complete any of the missions. ✅
Bugs, bugs, bugs! 😭
Although we tried our best, many of the players found several bugs 🪲, some more serious than others. Here’s a screenshot of our bugs/feedback tracker:
We have already addressed the most important bugs through updates. 💪 We started the playtest with build 0.104 and we are now on build 0.106.2.6.
Feedback Request 💌
If you’ve played the game and are yet to tell us what you think, we are anxiously waiting to hear from you. 🙈
Whether you enjoyed your experience or have any suggestions on how we can improve, we would deeply appreciate it if you could share them with us. 😁 Your feedback is our compass. Without it, we can’t refine our game or create more you’ll love.
You can simply reply to this email 📧 with your thoughts and/or improvement suggestions. 💓
Improvements 📈
Over the coming weeks, the team will gradually start implementing many of the improvement suggestions you’ve provided.
It’s vital to us that new players are able to easily navigate through the game and your gameplay insights will be instrumental in making the gaming experience more enjoyable and accurate for them.
Interested in participating? 🎮
If you are interested in participating in the playtest, but haven’t been able to do so, you are in luck! 😃
The playtest is still ongoing. Albeit with a limited number of keys 🔑 left.
Please respond to this email with your preferred playtest mode and we will send you a Steam key.
We have two playtest modes available, Gold and Regular.
Gold:
- Your first playtest session is live and recorded with team members providing assistance and assessing your interaction with the UI.
- You can schedule a playtest session at a time that suits you best.
- You can playtest further on your own with no assistance or recording.
- Discord Gold Membership access: All our gold members get instant access to Alpha and Beta builds, have their names included in the game’s credits, and will receive all future Visionaries games FREE.
Regular:
- You will be able to playtest on your own with no assistance or recording.
- Regular Discord Membership
And that’s a wrap for today, Cheers 🥂
Don’t forget to Wishlist the game if you haven’t.
Live Long and Prosper 👋,
Kunal & the team